一 <-> 四
此文不对下述组件进行一一介绍,更多详情参考相应官网。
https://github.com/prometheus/client_java
五、组件安装
5、1prometheus
操作环境:10.10.8.14  root/password

GITHUB:https://github.com/prometheus

下载方式:注意要下载GITHUB中编译后的文件,而不是go源码

目录:/data/software/workspace/prometheus/prometheus-2.17.1.linux-amd64.tar.gz

软链接:/data/software/install/prometheus

注意:README.md中有使用方式;LICENSE是许可证书.

配置文件:prometheus.yml和node-status.rules(自定义新加用于alertmanager,当前目录)

(见”七、配置文件汇总”部分)

启动:./prometheus &

访问地址:http://10.10.8.14:9090/
5、2alertmanager
操作环境:10.10.8.14 root/password
GITHUB:https://github.com/prometheus/alertmanager
下载方式:注意要下载GITHUB中编译后的文件,而不是go源码
目录:/data/software/workspace/alertmanager/alertmanager-0.20.0.linux-amd64
软链接:/data/software/install/alertmanager
配置文件:alertmanager-new.yml(自定义新加,当前目录)和email.tmpl(自定义新加,当前目录)
(见”七、配置文件汇总”部分)
启动:./alertmanager --config.file=alertmanager-new.yml &
访问地址:http://10.10.8.14:9093
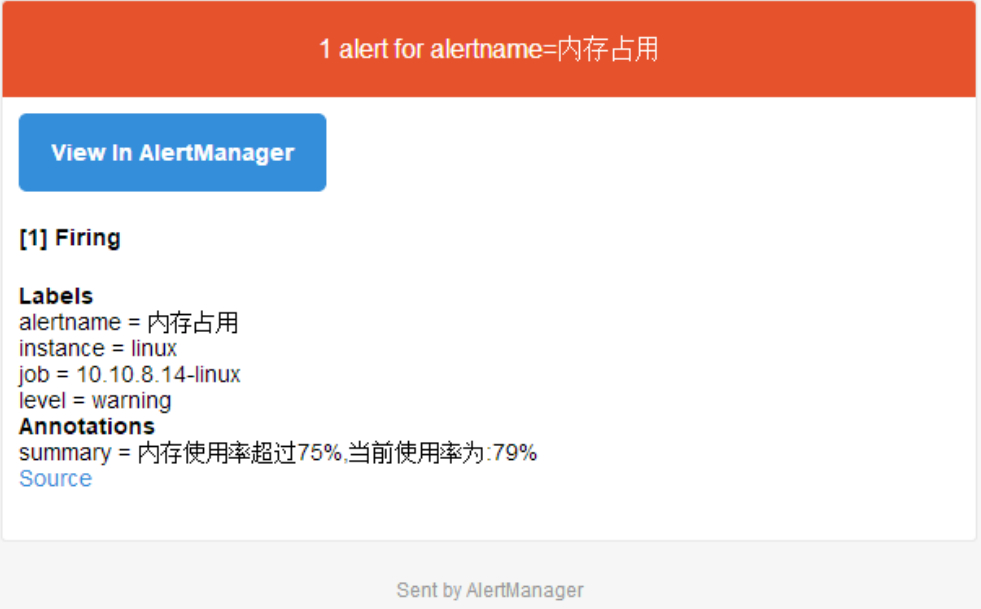
邮件告警效果图:
5、3grafana
操作环境:10.10.8.14 root/password
GITHUB:https://github.com/grafana/
下载方式:注意要下载GITHUB中编译后的文件,而不是go源码
目录:/data/software/workspace/grafana/grafana-6.7.1.linux-amd64.tar.gz
软链接:/data/software/install/grafana
注意:README.md中有使用方式;LICENSE是许可证书.
启动:./bin/grafana-server &
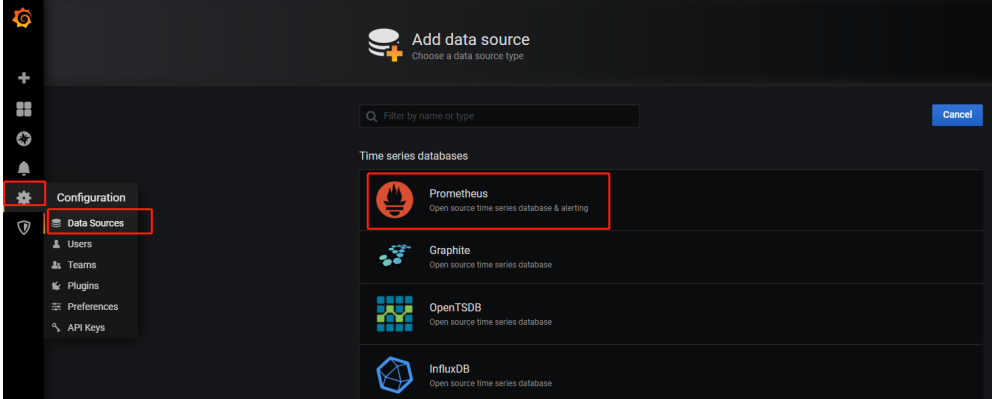
访问地址:http://10.10.8.14:3000/
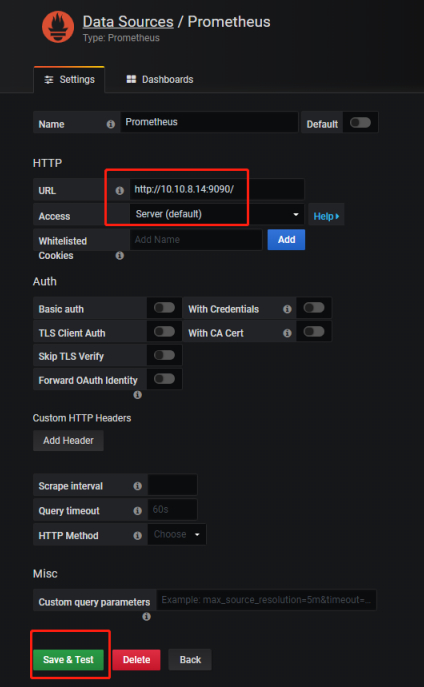
关联prometheus:
六、监控指标
6、1连接Linux
6、1、1prometheus 配置
prometheus.yml

  - job_name: '10.10.8.14-linux'

    static_configs:

      - targets: ['10.10.8.14:9100']

        labels:

          instance: linux
6、1、2 基本信息
操作环境:10.10.8.14  root/password

GITHUB:https://github.com/prometheus/node_exporter

下载方式:注意要下载GITHUB中编译后的文件,而不是go源码

目录:/data/software/workspace/node_exporter/node_exporter-0.18.1.linux-amd64.tar.gz

软链接:/data/software/install/node_exporter

注意:README.md中有使用方式;LICENSE是许可证书.

启动:./node_exporter &

访问地址(GET):http://10.10.8.14:9100
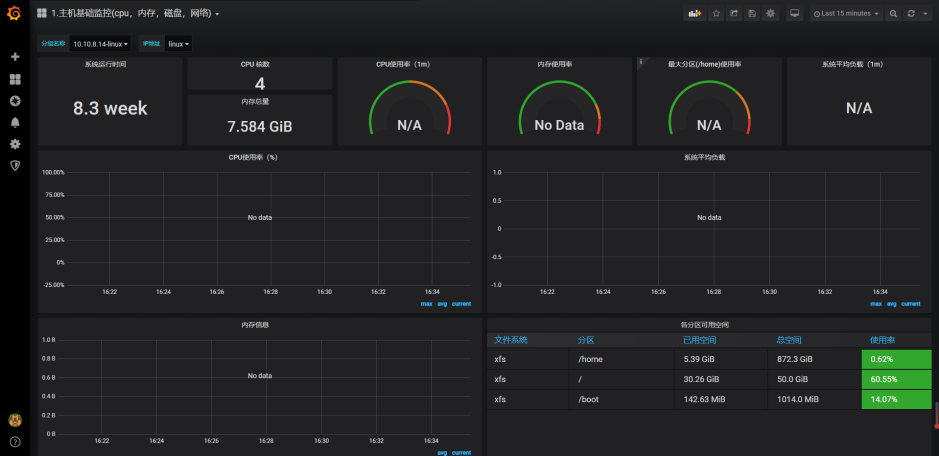
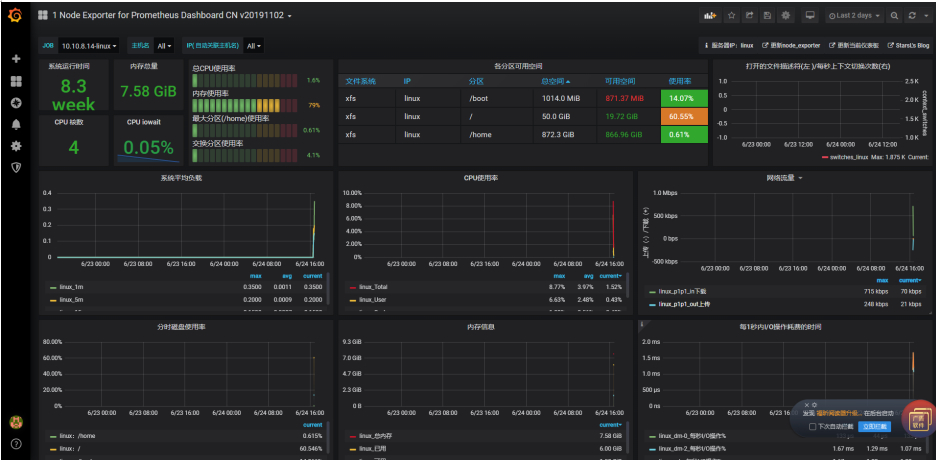
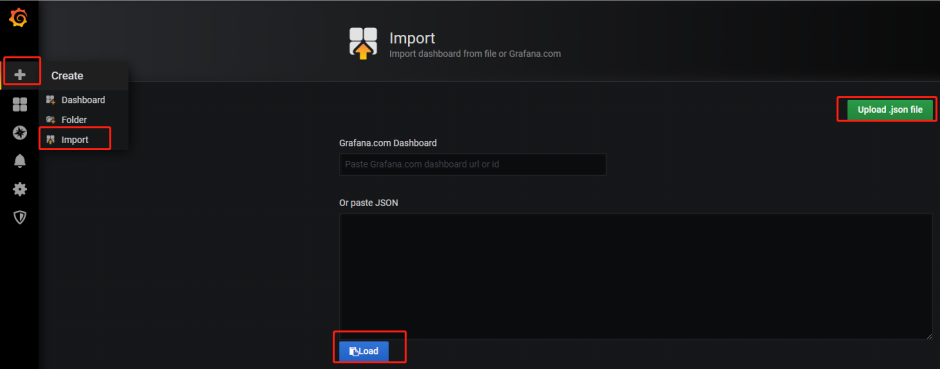
6、1、3grafana 模板

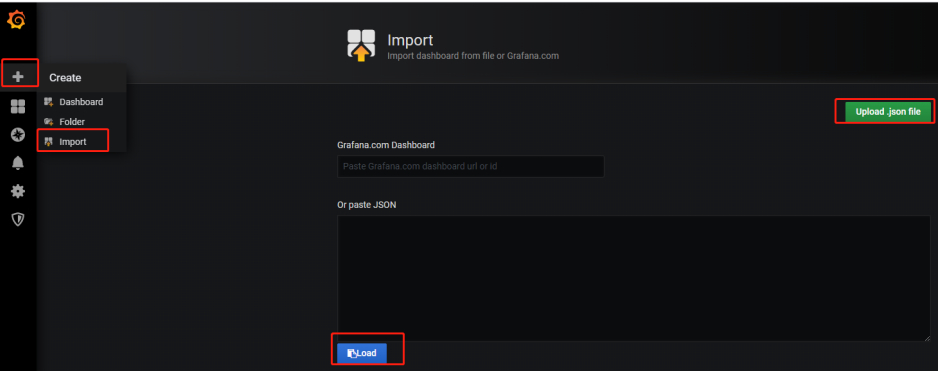
到 grafana 下载相应模板导入,
地址:https://grafana.com/grafana/dashboards?orderBy=name&direction=asc
比如这里是:
1-cpu_rev2.json
#主机基础监控(cpu,内存,磁盘,网络)
1-node-exporter-for-prometheus-dashboard-update-1102_rev11.json
#Node Exporter for Prometheus Dashboard CN v20191102
6、2 连接 MySQL
6、2、1prometheus 配置
prometheus.yml

  - job_name: '10.10.8.22-mysql'

    static_configs:

      - targets: ['10.10.8.22:9104']

        labels:

          instance: mysql
6、2、2 基本信息
操作环境:10.10.8.22/22  user/password

GITHUB:https://github.com/prometheus/mysqld_exporter

下载方式:注意要下载GITHUB中编译后的文件,而不是go源码

目录:/home/tomcat/prometheus/mysqld_exporter-0.12.1.linux-amd64.tar.gz

配置文件:my.cnf(自定义新加)

[client]

user=user

password=password

启动:

./mysqld_exporter --config.my-cnf=/home/tomcat/prometheus/mysqld_exporter-0.12.1.linux-amd64/my.cnf

访问地址(GET):http://10.10.8.22:9104

注意:README.md中有使用方式;LICENSE是许可证书.
6、2、3grafana 模板
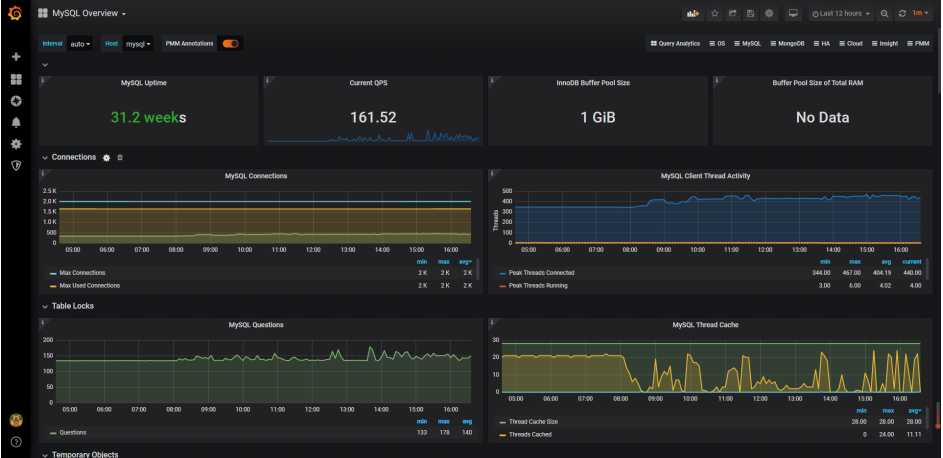
到 grafana 下载相应模板导入,
地址:https://grafana.com/grafana/dashboards?orderBy=name&direction=asc
比如这里是:
2-mysql-overview_rev5.json
#MySQL Overview
6、3 连接 Redis
6、3、1prometheus 配置
prometheus.yml


  - job_name: '10.10.8.22-redis'

    static_configs:

      - targets: ['10.10.8.14:9121']

        labels:

          instance: redis
6、3、2 基本信息
操作环境:10.10.8.14/22  user/password

GITHUB:https://github.com/oliver006/redis_exporter

下载方式:注意要下载GITHUB中编译后的文件,而不是go源码

目录:/data/software/workspace/redis_exporter/redis_exporter-v1.7.0.linux-amd64.tar.gz

软链接:/data/software/install/redis_exporter

注意:README.md中有使用方式;LICENSE是许可证书.

启动:nohup ./redis_exporter --redis.addr 10.10.8.22:6379 &

访问地址(GET):http://10.10.8.14:9121

有时运行一段时间,进程就断了。
6、3、3grafana 模板

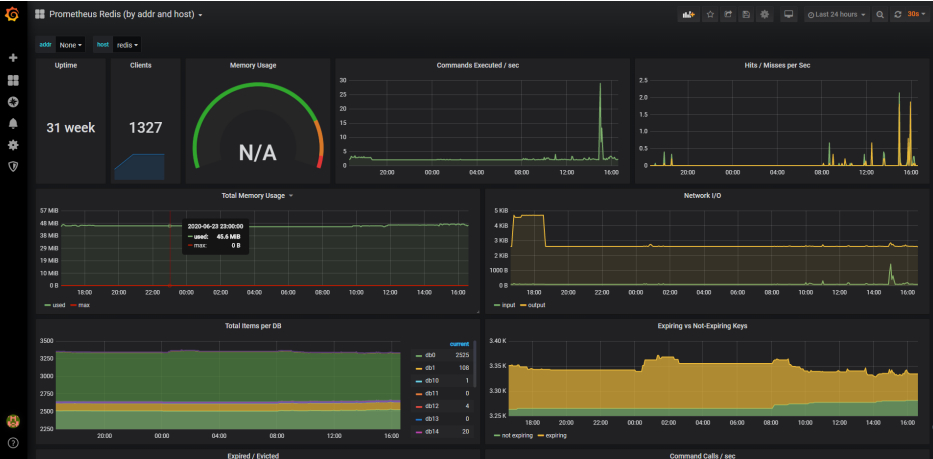
到 grafana 下载相应模板导入,
地址:https://grafana.com/grafana/dashboards?orderBy=name&direction=asc
比如这里是:
prometheus-redis-by-addr-and-host_rev1.json
#Prometheus Redis (by addr and host)
6、4 连接 nginx
openresty
操作环境:10.10.8.17/22  user/password

GITHUB:https://github.com/openresty/openresty

下载地址:http://openresty.org/cn/download.html

目录:/data/software/workspace/openresty/openresty-1.13.6.2.tar.gz

编译目录:/data/software/install/openresty_workspace

#须在”方式-1”中安装

注意:README.md中有使用方式;LICENSE是许可证书.
方式-1)Nginx VTS exporter
6、4、1prometheus 配置
prometheus.yml


  - job_name: '10.10.8.22-redis'

    static_configs:

      - targets: ['10.10.8.14:9121']

        labels:

          instance: redis
6、4、2 基本信息-插件配置
操作环境:10.10.8.17/22  user/password

GITHUB:https://github.com/hnlq715/nginx-vts-exporter

GITHUB:https://github.com/vozlt/nginx-module-vts

下载方式:注意要下载GITHUB中编译后的文件,而不是go源码

注意:README.md中有使用方式;LICENSE是许可证书.

目录:/data/software/workspace/nginx-vts-exporter/nginx-vts-exporter-0.10.3.linux-amd64.tar.gz

软链接:/data/software/install/nginx-vts-exporter

目录:/data/software/workspace/nginx-module-vts/nginx-module-vts-0.1.18.tar.gz

软链接:/data/software/install/nginx-module-vts
6、4、3 基本信息-nginx 安装
安装:cd /data/software/workspace/openresty/openresty-1.13.6.2

./configure --prefix=/data/software/install/openresty_workspace --with-luajit --with-pcre --with-http_iconv_module --with-http_realip_module --with-http_sub_module --with-http_stub_status_module --with-stream --with-stream_ssl_module

#这是重点,加到上面的最后

--add-module=/data/software/install/nginx-module-vts

配置文件:/data/software/install/openresty_workspace/nginx/conf/nginx.conf

软链接:ln -s /data/software/install/openresty_workspace/nginx/sbin/nginx /usr/bin/nginx

启动nginx:nginx

访问地址(GET):http://10.10.8.17/
6、4、4 基本信息-插件安装
配置文件:/data/software/install/openresty_workspace/nginx/conf/nginx.conf


http {

....

    log_format graylog2_json escape=json '{ "timestamp": "$time_iso8601", '

                     '"remote_addr": "$remote_addr", '

                     '"body_bytes_sent": $body_bytes_sent, '

                     '"request_time": $request_time, '

                     '"response_status": $status, '

                     '"request": "$request", '

                     '"request_method": "$request_method", '

                     '"host": "$host",'

                     '"upstream_cache_status": "$upstream_cache_status",'

                     '"upstream_addr": "$upstream_addr",'

                     '"http_x_forwarded_for": "$http_x_forwarded_for",'

                     '"http_referrer": "$http_referer", '

                     '"http_user_agent": "$http_user_agent" }';


    vhost_traffic_status_zone;


    server {

        listen       80;

        server_name  localhost;


....


location  / {

           return 301 https://$server_name$request_uri;

        }


  location /metrics {

    content_by_lua '

      metric_connections:set(ngx.var.connections_reading, {"reading"})

      metric_connections:set(ngx.var.connections_waiting, {"waiting"})

      metric_connections:set(ngx.var.connections_writing, {"writing"})

      prometheus:collect()

    ';

  }

       location /status {

           vhost_traffic_status_display;

           vhost_traffic_status_display_format html;

       }


....

    }

....


}


启动nginx:nginx -s reload

启动nginx-vts-exporter:

nohup ./nginx-vts-exporter -nginx.scrape_uri=http://10.10.8.17/status/format/json &

访问地址(GET):

http://10.10.8.17/status/

http://10.10.8.17:9913/metrics
6、4、5grafana 模板
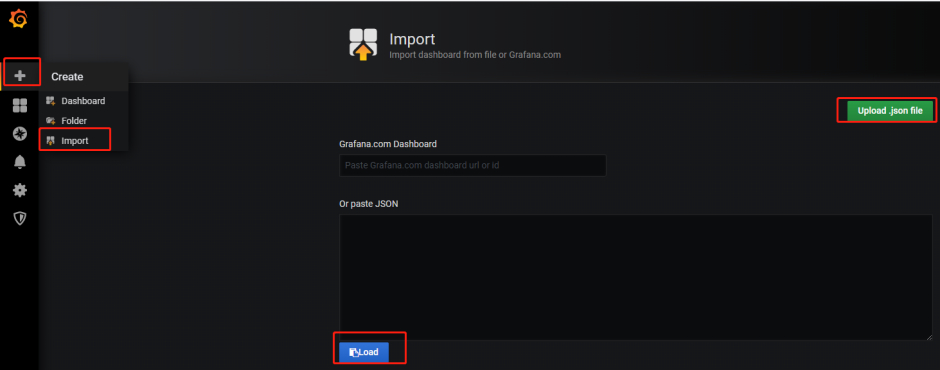
到 grafana 下载相应模板导入,
地址:https://grafana.com/grafana/dashboards?orderBy=name&direction=asc
比如这里是:
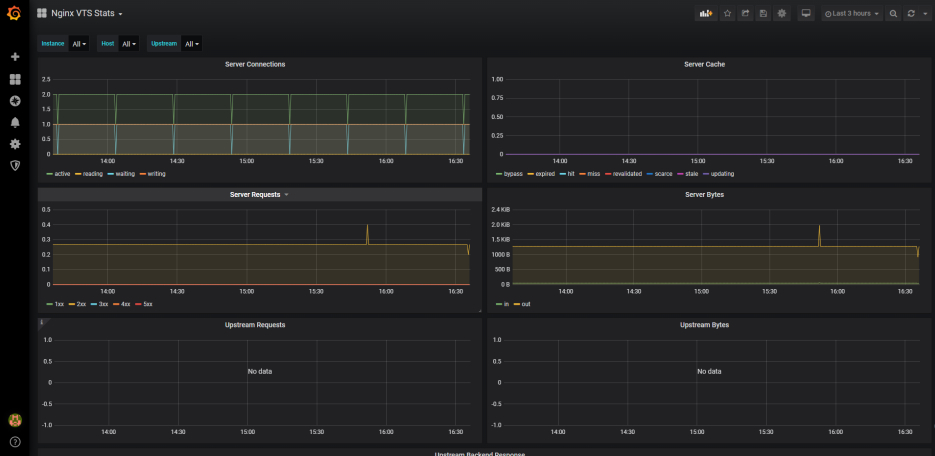
nginx-vts-stats_rev2.json
#Nginx VTS Stats
方式-2)nginx-lua-prometheus
6、4、1prometheus 配置
prometheus.yml


  - job_name: '10.10.8.17-nginx-lua'

    static_configs:

      - targets: ['10.10.8.17:9145']

        labels:

          instance: nginx-lua
6、4、2 基本信息-插件配置与安装
操作环境:10.10.8.17/22  user/password

GITHUB:https://github.com/knyar/nginx-lua-prometheus

目录:/data/software/workspace/nginx-lua-prometheus/nginx-lua-prometheus-0.20181120.tar.gz

软链接:/data/software/install/nginx-lua-prometheus

注意:README.md中有使用方式;LICENSE是许可证书.

配置文件:/data/software/install/openresty_workspace/nginx/conf/nginx.conf


http {

....


lua_shared_dict prometheus_metrics 10M;

lua_package_path "/data/software/install/nginx-lua-prometheus/prometheus.lua";

init_by_lua '

  prometheus = require("prometheus").init("prometheus_metrics")

  metric_requests = prometheus:counter(

    "nginx_http_requests_total", "Number of HTTP requests", {"host", "status"})

  metric_latency = prometheus:histogram(

    "nginx_http_request_duration_seconds", "HTTP request latency", {"host"})

  metric_connections = prometheus:gauge(

    "nginx_http_connections", "Number of HTTP connections", {"state"})

';

log_by_lua '

  metric_requests:inc(1, {ngx.var.server_name, ngx.var.status})

  metric_latency:observe(tonumber(ngx.var.request_time), {ngx.var.server_name})

';


server {

  listen 9145;


  location /metrics {

    content_by_lua '

      metric_connections:set(ngx.var.connections_reading, {"reading"})

      metric_connections:set(ngx.var.connections_waiting, {"waiting"})

      metric_connections:set(ngx.var.connections_writing, {"writing"})

      prometheus:collect()

    ';

  }


}


....


}


启动:nginx -s reload

访问地址:http://10.10.8.17:9145/metrics
6、4、3grafana 模板
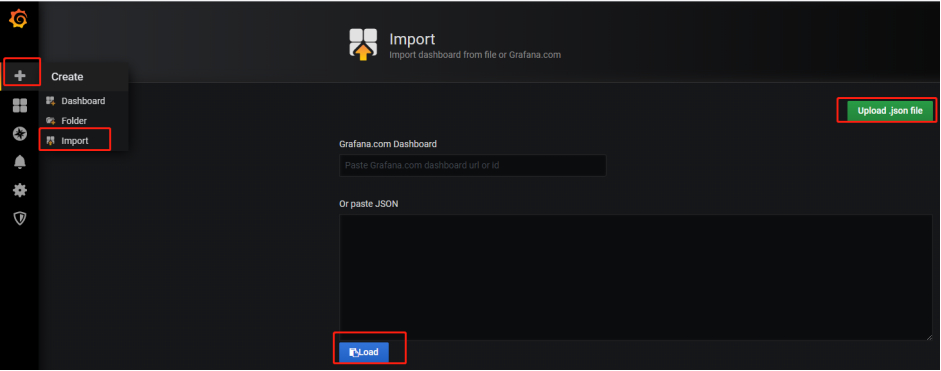
到 grafana 下载相应模板导入,
地址:https://grafana.com/grafana/dashboards?orderBy=name&direction=asc
比如这里是:
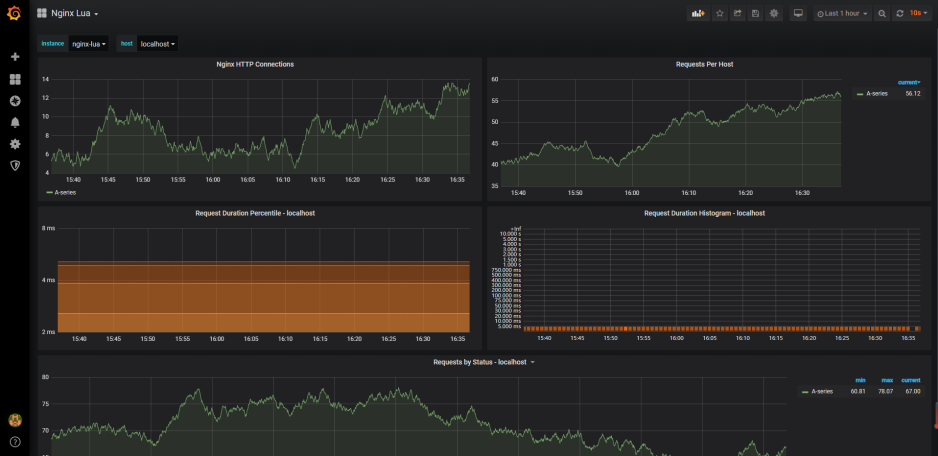
nginx-lua_rev2.json
#Nginx Lua
6、5JVM
6、5、1prometheus 配置
无
6、5、2 基本信息
比如启动一个 SpringBoot 即可。导入下述 JVM 模板能自动监听所有 JVM。
6、5、3grafana 模板
到 grafana 下载相应模板导入,
地址:https://grafana.com/grafana/dashboards?orderBy=name&direction=asc
比如这里是:
java-micrometer-basics_rev7.json
#Java Micrometer Basics
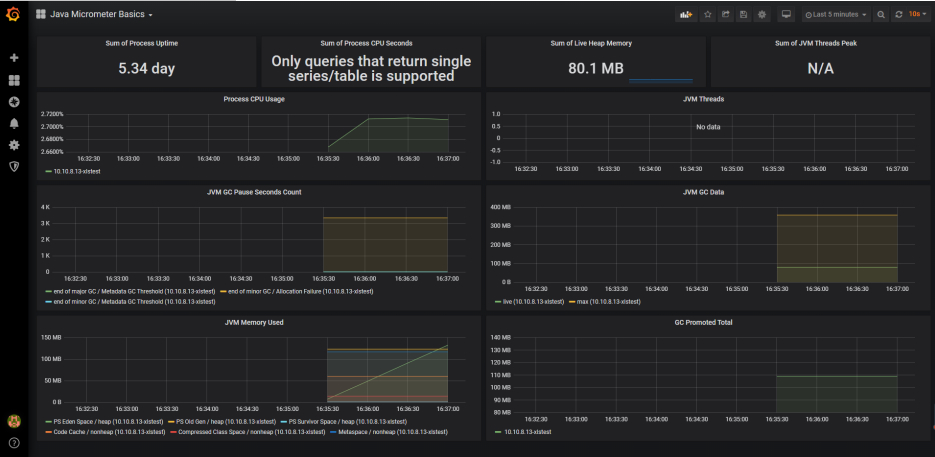
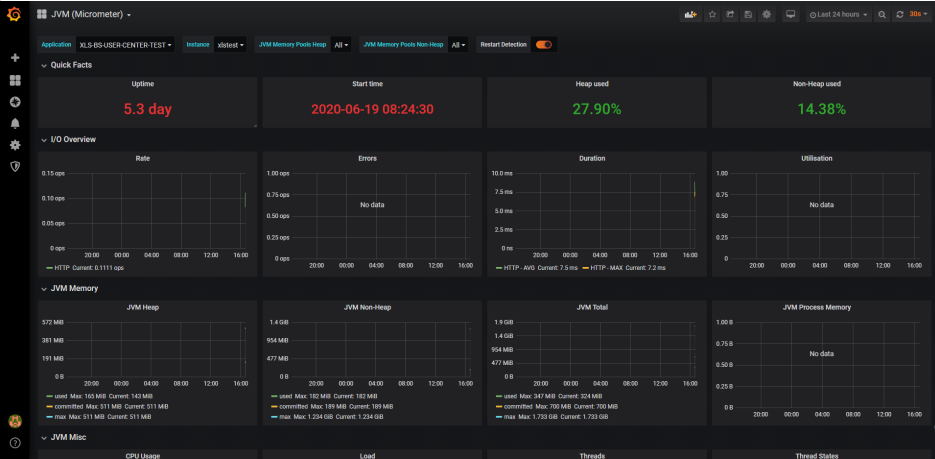
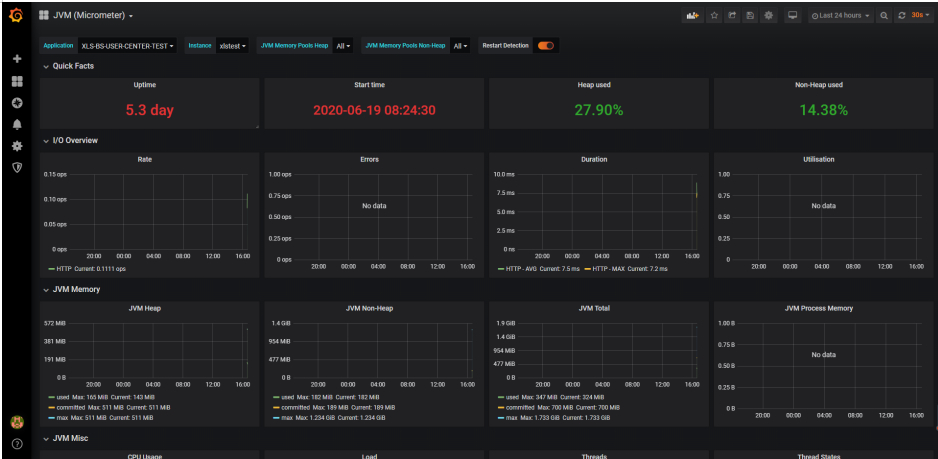
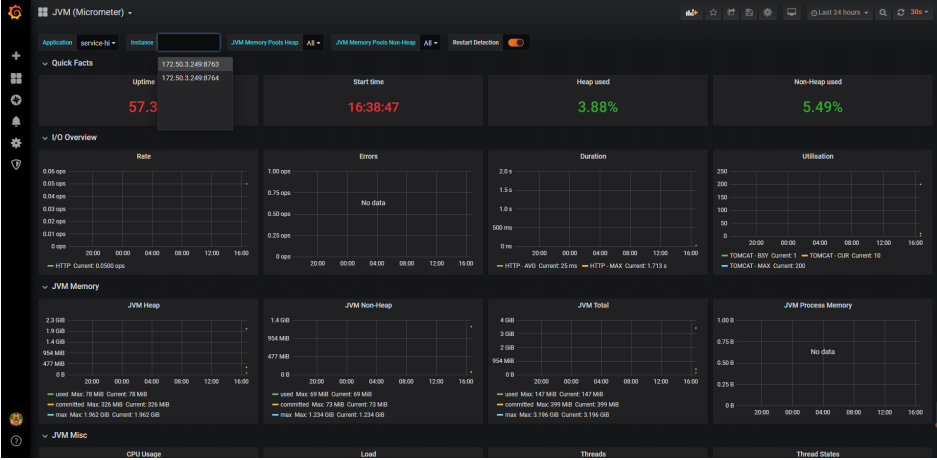
jvm-micrometer_rev9.json
#JVM (Micrometer)
6、6 连接单个 Java 应用
6、6、1prometheus 配置
prometheus.yml


  - job_name: '10.10.8.13-java'

    metrics_path: '/actuator/prometheus'

    static_configs:

      - targets: ['10.10.8.13:9301']

        labels:

          instance: java
6、6、2 基本信息
比如启动一个 SpringBoot 即可。上述端口就是此应用的端口。
6、6、3grafana 模板

到 grafana 下载相应模板导入,
地址:https://grafana.com/grafana/dashboards?orderBy=name&direction=asc
比如这里是:
java-micrometer-basics_rev7.json
#Java Micrometer Basics

jvm-micrometer_rev9.json
#JVM (Micrometer)
6、7连接springcloud-eureka 所有注册的 Java 应用
6、7、1prometheus 配置
prometheus.yml

  - job_name: 'eureka'
    scrape_interval: 20s
    metrics_path: '/actuator/prometheus'
    static_configs:
    consul_sd_configs:
      - server: '172.50.3.249:8891'
    relabel_configs:
      - source_labels: ['__meta_consul_tags']
        action: keep
      - source_labels: ['__meta_consul_service']
        target_label: job
      - source_labels: ['__meta_consul_address', '__meta_consul_service_metadata_management_port']
        separator: ':'
        target_label: __address__
6、7、2 基本信息
eureka-server
application.yml
spring:
  profiles: peer1
server:
  port: 8891
eureka:
  instance:
    hostname: peer1
  client:
    register-with-eureka: false
    service-url:
      defaultZone: http://${eureka.instance.hostname}:${server.port}/eureka/
    fetch-registry: false
pom.xml
<properties>
	<project.build.sourceEncoding>UTF-8</project.build.sourceEncoding>
	<project.reporting.outputEncoding>UTF-8</project.reporting.outputEncoding>
	<java.version>1.8</java.version>
	<spring-cloud.version>Greenwich.SR1</spring-cloud.version>
</properties>

<parent>
	<groupId>org.springframework.boot</groupId>
	<artifactId>spring-boot-starter-parent</artifactId>
	<version>2.1.3.RELEASE</version>
	<relativePath/>
</parent>

<dependencyManagement>
	<dependencies>
		<dependency>
			<groupId>org.springframework.cloud</groupId>
			<artifactId>spring-cloud-dependencies</artifactId>
			<version>${spring-cloud.version}</version>
			<type>pom</type>
			<scope>import</scope>
		</dependency>
	</dependencies>
</dependencyManagement>

<dependencies>
	<dependency>
		<groupId>org.springframework.cloud</groupId>
		<artifactId>spring-cloud-starter-netflix-eureka-server</artifactId>
	</dependency>
	<dependency>
		<groupId>org.springframework.boot</groupId>
		<artifactId>spring-boot-starter-test</artifactId>
	</dependency>
	<dependency>
		<groupId>at.twinformatics</groupId>
		<artifactId>eureka-consul-adapter</artifactId>
		<version>LATEST</version>
	</dependency>
</dependencies>

<build>
	<plugins>
		<plugin>
			<groupId>org.springframework.boot</groupId>
			<artifactId>spring-boot-maven-plugin</artifactId>
		</plugin>
	</plugins>
</build>


<repositories>
	<repository>
		<id>spring-milestones</id>
		<name>Spring Milestones</name>
		<url>https://repo.spring.io/milestone</url>
	</repository>
</repositories>
Java 应用
bean 配置
@Bean
MeterRegistryCustomizer<MeterRegistry> configurer(
		@Value("${spring.application.name}") String applicationName) {
	return (registry) -> registry.config().commonTags("application", applicationName);
}
application.yml
server:
  port: 8763
spring:
  application:
    name: service-hi
eureka:
  client:
    service-url:
      defaultZone: http://peer1:8891/eureka/
pom.xml
<properties>
	<project.build.sourceEncoding>UTF-8</project.build.sourceEncoding>
	<project.reporting.outputEncoding>UTF-8</project.reporting.outputEncoding>
	<java.version>1.8</java.version>
	<spring-cloud.version>Greenwich.SR1</spring-cloud.version>
</properties>

<parent>
	<groupId>org.springframework.boot</groupId>
	<artifactId>spring-boot-starter-parent</artifactId>
	<version>2.1.3.RELEASE</version>
	<relativePath/>
</parent>

<dependencyManagement>
	<dependencies>
		<dependency>
			<groupId>org.springframework.cloud</groupId>
			<artifactId>spring-cloud-dependencies</artifactId>
			<version>${spring-cloud.version}</version>
			<type>pom</type>
			<scope>import</scope>
		</dependency>
	</dependencies>
</dependencyManagement>

<dependencies>
	<dependency>
		<groupId>org.springframework.boot</groupId>
		<artifactId>spring-boot-starter-actuator</artifactId>
	</dependency>
	<dependency>
		<groupId>org.springframework.boot</groupId>
		<artifactId>spring-boot-starter-web</artifactId>
	</dependency>
	<dependency>
		<groupId>org.springframework.cloud</groupId>
		<artifactId>spring-cloud-starter-netflix-eureka-client</artifactId>
	</dependency>
	<dependency>
		<groupId>org.springframework.boot</groupId>
		<artifactId>spring-boot-starter-test</artifactId>
	</dependency>
	<dependency>
		<groupId>io.micrometer</groupId>
		<artifactId>micrometer-registry-prometheus</artifactId>
	</dependency>
</dependencies>

<build>
	<plugins>
		<plugin>
			<groupId>org.springframework.boot</groupId>
			<artifactId>spring-boot-maven-plugin</artifactId>
		</plugin>
	</plugins>
</build>
6、7、3grafana 模板

到 grafana 下载相应模板导入,
地址:https://grafana.com/grafana/dashboards?orderBy=name&direction=asc
比如这里是:
jvm-micrometer_rev9.json
#JVM (Micrometer)
七、配置文件汇总
prometheus.yml
#my global config
global:
  scrape_interval:     15s # Set the scrape interval to every 15 seconds. Default is every 1 minute.
  evaluation_interval: 15s # Evaluate rules every 15 seconds. The default is every 1 minute.
  # scrape_timeout is set to the global default (10s).

# Alertmanager configuration
alerting:
  alertmanagers:
  - static_configs:
    - targets:
      # - alertmanager:9093
       - localhost:9093

# Load rules once and periodically evaluate them according to the global 'evaluation_interval'.
rule_files:
  # - "first_rules.yml"
  # - "second_rules.yml"
  - "node-status.rules"

# A scrape configuration containing exactly one endpoint to scrape:
# Here it's Prometheus itself.
scrape_configs:
  # The job name is added as a label `job=<job_name>` to any timeseries scraped from this config.
  - job_name: 'prometheus'

    # metrics_path defaults to '/metrics'
    # scheme defaults to 'http'.

    static_configs:
    - targets: ['localhost:9090']

  - job_name: '10.10.8.14-linux'
    static_configs:
      - targets: ['10.10.8.14:9100']
        labels:
          instance: linux

  - job_name: '10.10.8.13-java
    metrics_path: '/actuator/prometheus'
    static_configs:
      - targets: ['10.10.8.13:9301']
        labels:
          instance: java

  - job_name: '10.10.8.22-mysql'
    static_configs:
      - targets: ['10.10.8.22:9104']
        labels:
          instance: mysql

  - job_name: '10.10.8.22-redis'
    static_configs:
      - targets: ['10.10.8.14:9121']
        labels:
          instance: redis

  - job_name: '10.10.8.17-nginx-vts'
    static_configs:
      - targets: ['10.10.8.17:9913']
        labels:
          instance: nginx-vts

  - job_name: '10.10.8.17-nginx-lua'
    static_configs:
      - targets: ['10.10.8.17:9145']
        labels:
          instance: nginx-lua

  - job_name: 'eureka'
    scrape_interval: 20s
    metrics_path: '/actuator/prometheus'
    static_configs:
    consul_sd_configs:
      - server: '172.50.3.249:8891'
    relabel_configs:
      - source_labels: ['__meta_consul_tags']
        action: keep
      - source_labels: ['__meta_consul_service']
        target_label: job
      - source_labels: ['__meta_consul_address', '__meta_consul_service_metadata_management_port']
        separator: ':'
        target_label: __address__
node-status.rules
groups:
- name: node-status

  rules:

  - alert: 节点存活
    expr: up == 0
    for: 9s
    labels:
      level: severity
    annotations:
      summary: "IP地址为{{ $labels.instance }}的节点,系统或程序已经停止运行,当前值为:{{ $value }}"

  - alert: CPU占用
    expr: round (100 - ((avg by (instance)(irate(node_cpu_seconds_total{mode="idle"}[1m]))) * 100 )) > 75
    for: 9s
    labels:
      level: warning
    annotations:
      summary: "CPU使用率超过75%,当前使用率为:{{ $value }}%"

  - alert: 内存占用
    expr: round (100- node_memory_MemAvailable_bytes / node_memory_MemTotal_bytes * 100 ) > 75
    for: 9s
    labels:
      level: warning
    annotations:
      summary: "内存使用率超过75%,当前使用率为:{{ $value }}%"

  - alert: 磁盘占用
    expr: round (100-100 * (node_filesystem_avail_bytes{fstype=~"xfs|ext4|ext3"} / node_filesystem_size_bytes{fstype=~"xfs|ext4|ext3"})) > 75
    for: 9s
    labels:
      level: warning
    annotations:
      summary: "磁盘使用率超过75%,当前使用率为:{{ $value }}%,挂载点为:{{ $labels.mountpoint }}"
nginx.conf
#user  nobody;
worker_processes  1;

#error_log  logs/error.log;
#error_log  logs/error.log  notice;
#error_log  logs/error.log  info;

#pid        logs/nginx.pid;


events {
    worker_connections  1024;
}


http {
    include       mime.types;
    default_type  application/octet-stream;

    #log_format  main  '$remote_addr - $remote_user [$time_local] "$request" '
    #                  '$status $body_bytes_sent "$http_referer" '
    #                  '"$http_user_agent" "$http_x_forwarded_for"';

    log_format graylog2_json escape=json '{ "timestamp": "$time_iso8601", '
                     '"remote_addr": "$remote_addr", '
                     '"body_bytes_sent": $body_bytes_sent, '
                     '"request_time": $request_time, '
                     '"response_status": $status, '
                     '"request": "$request", '
                     '"request_method": "$request_method", '
                     '"host": "$host",'
                     '"upstream_cache_status": "$upstream_cache_status",'
                     '"upstream_addr": "$upstream_addr",'
                     '"http_x_forwarded_for": "$http_x_forwarded_for",'
                     '"http_referrer": "$http_referer", '
                     '"http_user_agent": "$http_user_agent" }';

    #access_log  logs/access.log  main;

    sendfile        on;
    #tcp_nopush     on;

    #keepalive_timeout  0;
    keepalive_timeout  65;

    gzip  on;

    vhost_traffic_status_zone;


lua_shared_dict prometheus_metrics 10M;
lua_package_path "/data/software/install/nginx-lua-prometheus/prometheus.lua";
init_by_lua '
  prometheus = require("prometheus").init("prometheus_metrics")
  metric_requests = prometheus:counter(
    "nginx_http_requests_total", "Number of HTTP requests", {"host", "status"})
  metric_latency = prometheus:histogram(
    "nginx_http_request_duration_seconds", "HTTP request latency", {"host"})
  metric_connections = prometheus:gauge(
    "nginx_http_connections", "Number of HTTP connections", {"state"})
';
log_by_lua '
  metric_requests:inc(1, {ngx.var.server_name, ngx.var.status})
  metric_latency:observe(tonumber(ngx.var.request_time), {ngx.var.server_name})
';


server {
  listen 9145;
#  allow 10.10.0.0/16;
#  deny all;

  location /metrics {
    content_by_lua '
      metric_connections:set(ngx.var.connections_reading, {"reading"})
      metric_connections:set(ngx.var.connections_waiting, {"waiting"})
      metric_connections:set(ngx.var.connections_writing, {"writing"})
      prometheus:collect()
    ';
  }

}


    server {
        listen       80;
        server_name  localhost;

	#charset koi8-r;

        #access_log  logs/host.access.log  main;

       # location / {
       #    root   html;
       #    index  index.html index.htm;
       # }

	location  / {
           return 301 https://$server_name$request_uri;
        }


  location /metrics {
    content_by_lua '
      metric_connections:set(ngx.var.connections_reading, {"reading"})
      metric_connections:set(ngx.var.connections_waiting, {"waiting"})
      metric_connections:set(ngx.var.connections_writing, {"writing"})
      prometheus:collect()
    ';
  }

       # location /vts_status {
       #     vhost_traffic_status_display;
       #     vhost_traffic_status_display_format html;
       #     allow 127.0.0.1;
       #     deny all;
       # }

       location /status {
           vhost_traffic_status_display;
           vhost_traffic_status_display_format html;
       }


        #error_page  404              /404.html;

        # redirect server error pages to the static page /50x.html
        #
        error_page   500 502 503 504  /50x.html;
        location = /50x.html {
            root   html;
        }

        # proxy the PHP scripts to Apache listening on 127.0.0.1:80
        #
        #location ~ \.php$ {
        #    proxy_pass   http://127.0.0.1;
        #}

        # pass the PHP scripts to FastCGI server listening on 127.0.0.1:9000
        #
        #location ~ \.php$ {
        #    root           html;
        #    fastcgi_pass   127.0.0.1:9000;
        #    fastcgi_index  index.php;
        #    fastcgi_param  SCRIPT_FILENAME  /scripts$fastcgi_script_name;
        #    include        fastcgi_params;
        #}

        # deny access to .htaccess files, if Apache's document root
        # concurs with nginx's one
        #
        #location ~ /\.ht {
        #    deny  all;
        #}
    }


    # another virtual host using mix of IP-, name-, and port-based configuration
    #
    #server {
    #    listen       8000;
    #    listen       somename:8080;
    #    server_name  somename  alias  another.alias;

    #    location / {
    #        root   html;
    #        index  index.html index.htm;
    #    }
    #}


    # HTTPS server
    #
    #server {
    #    listen       443 ssl;
    #    server_name  localhost;

    #    ssl_certificate      cert.pem;
    #    ssl_certificate_key  cert.key;

    #    ssl_session_cache    shared:SSL:1m;
    #    ssl_session_timeout  5m;

    #    ssl_ciphers  HIGH:!aNULL:!MD5;
    #    ssl_prefer_server_ciphers  on;

    #    location / {
    #        root   html;
    #        index  index.html index.htm;
    #    }
    #}

}
alertmanager-new.yml
global:
  resolve_timeout: 5m
smtp_smarthost: 'smtp.XX.com:25(不加密默认端口25,自己根据第三方定义)'
  smtp_from: 'XX@XX.com'
  smtp_auth_username: 'XXs@XX.com'
  smtp_auth_password: 'XX'
  smtp_require_tls: false
templates:
  - 'email.tmpl'
route:
  group_by: ['alertname']
  group_wait: 10s
  group_interval: 10s
  repeat_interval: 1h
  receiver: 'email'
receivers:
- name: 'email'
  email_configs:
  - to: 'XX@XX.com'
    headers: { Subject: "Prometheus-告警邮件" }
inhibit_rules:
  - source_match:
      severity: 'critical'
    target_match:
      severity: 'warning'
    equal: ['alertname', 'dev', 'instance']
email.tmpl
{{ define "email.to.html" }}

{{ if gt (len .Alerts.Firing) 0 -}}
{{ range .Alerts }}
(异常信息) <br>
============================================== <br>
告警程序: AlertManager <br>
告警状态: {{ .Status }} <br>
告警级别: {{ .Labels.level }} <br>
告警类型: {{ .Labels.alertname }} <br>
故障节点: {{ .Labels.instance }} <br>
触发时间: {{ (.StartsAt).Format "2006-01-02 15:04:05" }} <br>
详细信息: {{ .Annotations.summary }} <br>
============================================== <br>
{{ end }}
{{ end }}

{{ if gt (len .Alerts.Resolved) 0 -}}
{{ range .Alerts }}
(恢复信息) <br>
============================================== <br>
告警程序: AlertManager <br>
告警状态: {{ .Status }} <br>
告警类型: {{ .Labels.alertname }} <br>
恢复节点: {{ .Labels.instance }} <br>
恢复时间: {{ (.EndsAt).Format "2006-01-02 15:04:05" }} <br>
============================================== <br>
{{ end }}
{{ end }}
{{ end }}
标题:prometheus监控(采集)+alertmanager告警(邮件)+grafana视图化(展示)的基本操作
作者:yazong
地址:https://blog.llyweb.com/articles/2020/06/24/1592991488130.html